
Have you found your PC hot? If you find your machine slowing down or failing, then overheating may be why you have to experience the issue. This article has given the best CPU temperature monitor tools available. Generally, all PCs and servers can emit heat, but a computer can withstand a limited amount of heat. When the limitation of heat crosses, it will damage your hardware. These help to monitor CPU temperature from one location. Thus, it enables you to identify the time while your hardware devices get overheated. As a result, you can fix the issue before any damage.
What is CPU temperature monitor tools?
CPU temperature monitor tools are software letting you check the temperature of your Central Processing Unit, voltage, fan speed, battery, etc. When you collect the metrics from sensors, these help you protect your Central Processing Unit from damage.
Who needs CPU Temperature Monitor?
Usually, gamer and graphic designers are high-performance users. They exchange parts for running the PC quickly. Besides, they overclock the PC to run the online games smoothly. But overclocking can boost the Central Processing Unit temperature.
Professionals access their computers for hours, for which they may experience heated computers. Besides, these can encounter viruses such as file and system infectors and macros, worms from the internet, network, or emails, and Trojans (Rootkit and backdoor). These can increase the Central Processing Unit temperature.
Reasons that can raise the CPU Temperature:
Dust, fan speed, or overclocking are some of the reasons for the high temperature of the Central Processing Unit. Besides, the processor may not work correctly for malware attacks raising the Central Processing Unit temperature.
We have told earlier that viruses, worms, trojans, etc., are a few types of malware infections making the temperature rise. In addition, a few programs need higher Central Processing Unit requirements, including Video and Graphics editing programs, Games with high-resolution graphics, DVD burning programs, etc. Sometimes, an autostart program can affect Central Processing Unit usage. In addition, your browser can use the CPU’s processing power because add-ons and plugins run in the background.
What is Normal CPU Temperature?
The normal temperature should be 45- 50 degrees Celsius, and it is the idle temperature of a computer. The processor will experience a higher load if you play a game or do intensive tasks. As a result, the temperature will become around 70 to 80 degrees Celsius. The maximum temperature of the processor is between 80 to 100 degrees Celsius. You can see the clock speed decreasing at the high temperature.
Why is it essential to monitor Computer Temperature?
If your processor has a high temperature, it can damage the motherboard or other devices.
A significant aspect that can affect a server room is temperature. When you encounter high temperatures, your servers can get damaged. If it’s due to overheating, it can cause permanent damage.
However, you should know one thing you have to adjust server rooms with internal and external sensors. You can find integrated internal sensors in almost all PCs and processors.
Advantages of using CPU temperature monitor tools?
Improves performance:
Your PC performance gets affected when it experiences an increased amount of heat. In this case, your computer can work slowly, which can kill your productivity. That is why you need to use a cpu monitor tool to ensure that your PC runs at optimal speed.
Prevents PC from heat damage:
Excessive heat can cause malfunction to your device, and as a result, it gets shut down abruptly. Using the software allows you to detect the temperature and take steps to prevent possible damage.
Boosts the lifespan of your Windows computer:
When you use the software, it ensures that the processor is safe from excessive heat, humidity, and other damaging factors. Thus, it helps to boost the longevity of your computer system.
Confirm the uptime and reliability of the data center:
If you’re willing to have optimal uptime and reliability in a data center, your device should have favorable environmental conditions like recommended levels of temperature, power, humidity, etc. In this case, you have to monitor your server rooms.
Best CPU temperature monitor tools:
1) Core Temp:
The software weighs light and is simple to use for Windows computers. You can use it with most processors, and it shows the temperature for each core. In addition, it allows you to display other basic system information, including the processor model, platform, and frequency.
In addition, the software can display the temperature in real-time, and it doesn’t require any resources to use. The CPU Temperature Monitor application enables you to run it in the background without slowing down your other programs. Hence, it may ask you to tap on ‘show hidden icons’ in the taskbar when you want to view the temperature for each core.
Moreover, if you are willing, you can install add-ons to boost its functionality. In addition, the application developer released mobile versions of the app for Android and Windows Phone devices.
2) Speed Fan:
The CPU Temperature Monitor software provides easy-to-use monitoring and other helpful features. For example, it can display the temperature of the processor. Besides, the software can display the system’s temperature, graphics card, and individual cores in a multi-core processor.
The application is compatible with all versions of Windows, from Windows 95 to Windows 10. In addition, it allows you to use it on both x86 and 64-bit processors. Finally, the app lets you see and control fan speeds for compatible processors and motherboards.
Moreover, it enables you to decrease the speed of the fans until you hear any extra sound. As soon as the application identifies a high temperature, it raises the speed automatically to 100%. If you are an advanced user, you can find different features and data to monitor the systems, like accessing SMART hard drive info and hard drive temperatures.
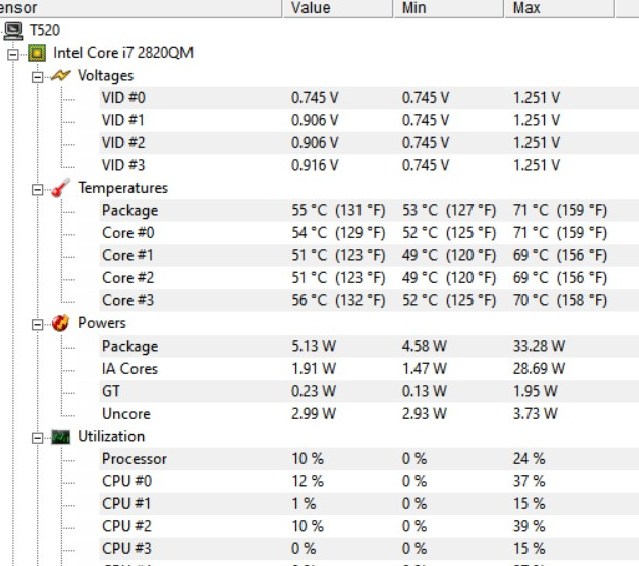
3) HWMonitor:
It is a detailed hardware monitoring program from the famous CPU-Z freeware software developers. The program supports both 32-bit and 64-bit processors.
Besides, it gets updated frequently for continued support with modern processors. If you want to use the program, download an installable version of HWMonitor or a non-installable version in a ZIP folder. When you download the installable version, it will add HWMonitor to the start menu. On the other hand, you can run the program without installing it when installing the ZIP folder.
With the program’s help, you can read different health sensors inside your system. For example, it allows you to see the temperatures of the Central Processing Unit, hard drives, motherboard, and graphics card. Besides, it lets you monitor the voltage, fan speeds, and SMART info.
You can use two modes to monitor your Central Processing Unit’s health. You can select the summary-only mode or choose the sensors-only. Selecting the sensors-only mode will provide you with a long list of details asking you about the system’s health. All the details you get in the monitor are beneficial, but it is not ideal to use during gaming. In this case, if you want, use the summary-only mode. HWMonitor is a very reliable and lightweight program for Windows PCs.
4) Real Temp:
The CPU Temperature Monitor program is compatible with merely Intel Core-based processors, and it doesn’t support AMD processors or Pentium 4 processors.
Whether you use an Intel Core processor, you should install the application on a Windows PC running Windows 2000 to Windows 10. It is suitable for both 32-bit and 64-bit processors.
It comes with some unique features helping to monitor the temperature better. For example, the program uses test sensors, logs the minimum and maximum Central Processing Unit temperatures, etc. Besides, it comes with a high-temperature alarm and shutdown feature also. In addition, it enables you to view the Central Processing Unit and GPU temperatures. However, you can not see extra system info on it.
5) AIDA64 Extreme:
This hardware detection engine is especially for power users. If you are one of those who want to overclock the PC can enjoy the advanced diagnostic functions of this program.
If you’re willing, download and install a free 30-day trial version. Whether you want to use the full version, you must pay for it. Although it is not a free program, it can still offer the most incredible range of features for monitoring your system.
It allows you to see the temperature of each component, including the memory read, write, and copy speeds. Besides, it lets you see detailed information to run applications and helps power users identify the best settings for overclocking. The application supports all modern 32-bit and 64-bit versions like Windows 10.
6) Open Hardware Monitor:
The software can offer an easy-to-use interface helping you to monitor temperature sensors, voltages, fan speeds, and the clock speeds of the PC. Besides, the program can display SMART hard drive info.
It is suitable for 32-bit and 64-bit Windows PCs, all versions from XP to Windows 10. In addition, the application allows you to install it on x86-based Linux operating systems. Furthermore, you can use the program with both Intel and AMD processors. Besides, it enables you to use ATI and Nvidia graphics cards.
It is an open-source project indicating that developers can take the help of the source code if necessary for their projects. However, you don’t need to install it, just download the ZIP folder, and then your job is to extract the files. After that, you should run it with Administrator rights.
7) CPU Thermometer:
It is a lightweight program compatible with most Intel and AMD processors. You can use the program in 32-bit and 64-bit Windows OSs, including Vista, 2008, 7, and 10.
You can see an essential list of CPU cores with temperatures in the modern version. Besides, it contains the total Central Processing Unit load capacity for each core. Finally, it lets you display the processor temperature in the system tray rather than leaving the window open.
It also comes with some basic options and enables you to set a maximum Central Processing Unit temperature. As soon as you see the maximum temperature value, choose to display a warning message. Then, turn off the PC or restart your computer.
8) Speccy:
It is a free PC monitoring program that originated from the developers of CCleaner. You can see all system info regarding the Central Processing Unit, RAM, motherboard, operating system, graphics card, storage disks, and other hardware. Besides, the program allows you to see the temperature of critical components like the Central Processing Unit and motherboard.
The software enables you to use it to make detailed reports. In addition, it allows you to see the performance of your hardware over a set period. However, it is not as light as other programs. It provides more details about the type of hardware you have installed on your PC.
Along with the free version, you can also get a premium version. Besides, it offers customer support and automatic updates. In addition, the company offers a bundled package including Speccy, CCleaner, Recuva, and Defraggler.
9) Enhanco Free:
This general tweaking tool is primarily for Windows, and its developer has made new versions that support Windows Vista, 7, 8, and now Windows 10. The program lets you tweak many hardware and software components on the PC like security, disk cleaner, defragment, registry cleaner, etc. In addition, it provides system monitoring features like Central Processing Unit temperature, Central Processing Unit speed frequency, RAM information, etc.
10) HWiNFO:
You can get more details about the PC from the Freeware app than how much you will ever need. The app supports all Windows OS versions, including Windows 98 and Windows 10. Besides, it is suitable for various hardware components, like Central Processing Units, Graphics cards, and Chipsets.
The software can customize alerts and provide notifications. Besides, it gives you reports, and this program is one of the best ones on this list.
11) Paessler CPU Temperature Monitoring:
It helps you to monitor the temperature of the processor with ease. Furthermore, you can use the app to check the performance of routers, servers, and switches. Besides, it makes you sure that your processor will remain stable. This flexible program offers maps and dashboards. If the usage of the processor exceeds, it can provide a quick notification. In addition, it decreases the Central Processing Unit overload.
12) CPU Load Monitor:
It allows you to configure and manage logs easily. With the help of the tool, you can monitor network stress with ease. The program lets you load the processor and provides real-time monitoring and alerting. Besides, the tool enables you to scan the IP address to find the range of IP addresses.
Moreover, it can analyze memory utilization and boost network security. The program is connected with SolarWinds NPM (Network Performance Monitor) solution.
13) SIW:
This Windows-based CPU Temperature Monitor software is downloadable and provides functional & advanced system details for computers. It is one of the best tools that help collect information about the system, and you can get the information in an easy-to-understand format.
With the program’s help, you can make a report file in HTML, TXT, XML, or CSV format. Besides, the program is compatible with different client platforms, including Windows 10, Windows 8.1, Windows 7, etc.
It is suitable for different PC hardware and software, network information, software licensee management, security audit, etc. You don’t have to install the software to check PC temperature. The software allows you to run itself from a network drive, flash drive, domain login script, etc. It lets you use it on many server platforms, including Windows 2019, Windows 2016, Windows 2012, etc. In addition, you can get software updates offering you accurate results.
14) SolarWinds CPU Load Monitor:
The software contains an Engineer’s toolset. For example, business networks can sometimes cause excess traffic and Central Processing Unit load on the routers. But using the software, you can simultaneously monitor the loan on many Cisco routers and graphs. As a result, you can remain ahead of issues.
In addition, you can see the warning and alarm thresholds for every device separately using the tool. Besides, it is compatible with IPv6 and SNMP v3. Finally, you can find here the red bar, which represents a critical level. You can access over 60 network management tools using the Engineer’s Toolset.
It is an all-in-one solution helping you to manage the network. Besides, the app allows you to adjust a Central Processing Unit temperature. Although it comes at a high price, it is a practical choice for troubleshooting a network. You can use the fully functional free trial of the toolset for 14 days. After that, its price begins at $1495.
15) MSI Afterburner:
Most people should know about MSI’s monitoring tool. But if you don’t have one, you must use the software. Generally, people use the tool to benchmark computer hardware in games, and however, it can offer a comprehensive benchmarking suite by providing extra features.
16) Atera:
This one is a cloud-based platform coming with all features of the software. It has almost all the essential features that a managed service provider (MSP) requires to run its business.
The home screen of the dashboard offers a system overview. It employs an alert-based system that notifies an administrator when something is wrong with the monitored system. Therefore, it is simple to spot issues at a glance. In addition, the operator can click through to check the details of individual pieces of equipment from the summary screen.
The device, endpoint, or server monitoring screens have many statuses, like Central Processing Unit performance data. These feedback categories are all live, including Central Processing Unit temperature, utilization, and capacity.
In addition, many other aspects include fan performance, memory usage, disk activity, and I/O throughput rates.
It is a lightweight cloud-based monitoring app focusing on MSP/resellers. As a result, it becomes an ideal option to offer temperature readouts as a part of your service offering. In addition, you can provide excellent visual dashboards and report capabilities than its competitors.
17) SpeedFan:
It is a hardware monitor which can monitor temperature, fan speed, voltage, and brutal disk temperatures. Besides, it allows you to display SMART data from hard disks. Furthermore, the software helps you configure the program to change fan speeds remotely as per the system temperatures. For instance, it enables you to select a minimum and maximum fan speed.
The monitor is free to use. Besides, it has an easy-to-use user interface. In addition, it can detect temperature sensors automatically. Therefore, you should not waste your time making extensive configurations.
If you are willing to engage with more complex configurations, you may do it on the Advanced page. For example, it allows you to offset wrong temperature readings and control fan speed.
Similarly, you may do it through the Charts window if you want to view visual displays. For example, you can see the performance charts in the Charts window, enabling you to select what metrics you want to monitor. In this case, you have only to put the start and end time of your reading, the elements you are willing to monitor, and the values you are eager to see.
It is simple to install, due to which it can start pulling metrics immediately. Besides, the program comes with an easy-to-use interface specially made for machine monitoring. In addition, it can help you to correlate fan speed with temperature.
How to reduce CPU Temperature:
Multiple ways are there through which you can resolve overheating problems. It allows you to use straightforward techniques like dusting the Central Processing Unit fan, using a more powerful air cooler fan, or applying a new thermal paste. You need to know that liquid cooling can provide better results at transferring heat than air. It can decrease the Central Processing Unit temperature by 50-60 °F (10-15°C).
All processors don’t need liquid cooling. However, air cooling can make the processor overheat when it cannot match the processor requirements. For example, suppose you use a 150W air cooler in a Central Processing Unit requiring 200W. In this case, the processor will overheat and throttle. So, along with using liquid cooling, you can take the help of these more straightforward techniques to reduce and maintain feasible temperatures for Central Processing Units.
- You should not perform overclocking if not necessary. Hence, you can improve the airflow inside the case.
- If you are willing, put the PC in a cold environment.
- Clean the PC daily to remove dust and dirt.
- If there is any defective fan or heatsink, you should replace it.
- You can apply thermal paste on your processor if necessary and heat sinks.
- Turn off unused background programs. Besides, you should purchase cooling pads for the laptop.
The bottom line:
All these CPU Temperature Monitor software are helpful and free to use generally. A few of these provide a free trial and enable you to use any Windows PC freely. You can install any of these monitors today to watch your CPU processor. The reason is that the Central Processing Unit is a vital component of the computer.
Frequently Asked Questions:
- How do you see CPU temp on your desktop?
No Central Processing Unit temperature monitor is available in your OS. If you are willing to get details about Central Processing Unit temperature, you need to go down to the BIOS. You can install a monitoring tool very easily, and it is advised to use the SolarWinds Central Processing Unit Load Monitor to check on heat-generating activities. Besides, you can use the HWMonitor to interpret BIOS data in a GUI interface.
- Why is your CPU temperature 70 degrees on an idle laptop?
If you are very active, your PC can have a temperature of 70 degrees Celsius. When your computer remains idle, the temperature should be around 45 degrees. While you have a high temperature, the processor has a heavy workload on background tasks and services. If the monitor displays that it is not causing the problem, ensure that the high temperature is a sign of a broken fan.
- How do you check your Central Processing Unit usage?
- You can find Central Processing Unit usage as a live metric in the Task Manager if you use windows.
- After that, you need to tap on the Task Bar at the bottom of the screen.
- Next, choose Task Manager from the pop-up menu.
- Now, you have to wait for this Task Manager to open. After that, tap on the Performance tab.
- Tap on the CPU option available at the top of the left-hand options list to see a live graph of CPU performance.